
Sometimes model-driven apps can be considered quite “boring” due to their predictability in how the interface is presented. Personally I love the interface and the simplicity it can offer(if configured correctly!).
Adding visual elements to your model-driven apps can greatly enhance the user experience and improve adoption.
Setting up hierarchy is a great example of adding a visual element to your apps whilst providing a great way to present self referencing relationships (a relationship which references itself).
Create the Hierarchy
Setting up hierarchy on tables requires a few steps, some of which aren’t clear when reading the documentation. (Here for reference).
In this example we'll create a table called Users, and add the following column types:
| Column Name | Column Type |
|---|---|
| Name | Text |
| Text(Email) | |
| Manager | Lookup |
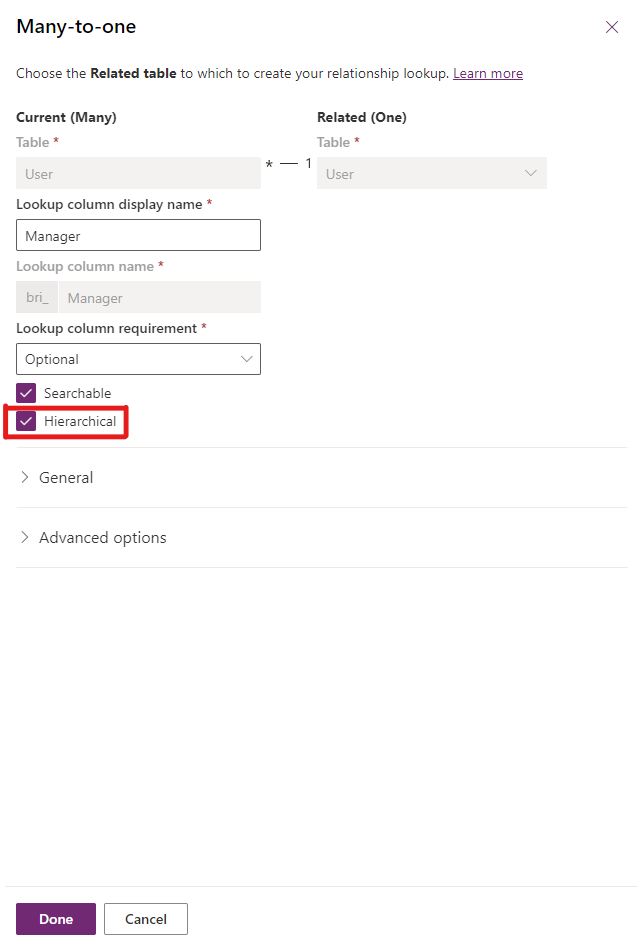
The Manager Lookup is configured to lookup to the same(Users) table. This is a self referencing relationship which we can configure hierarchy for.
After the columns have been set up, navigate to table relationships, and select the manager relationship. You should see an option labelled "Hierarchical". Tick this to turn it on, and then click Save.
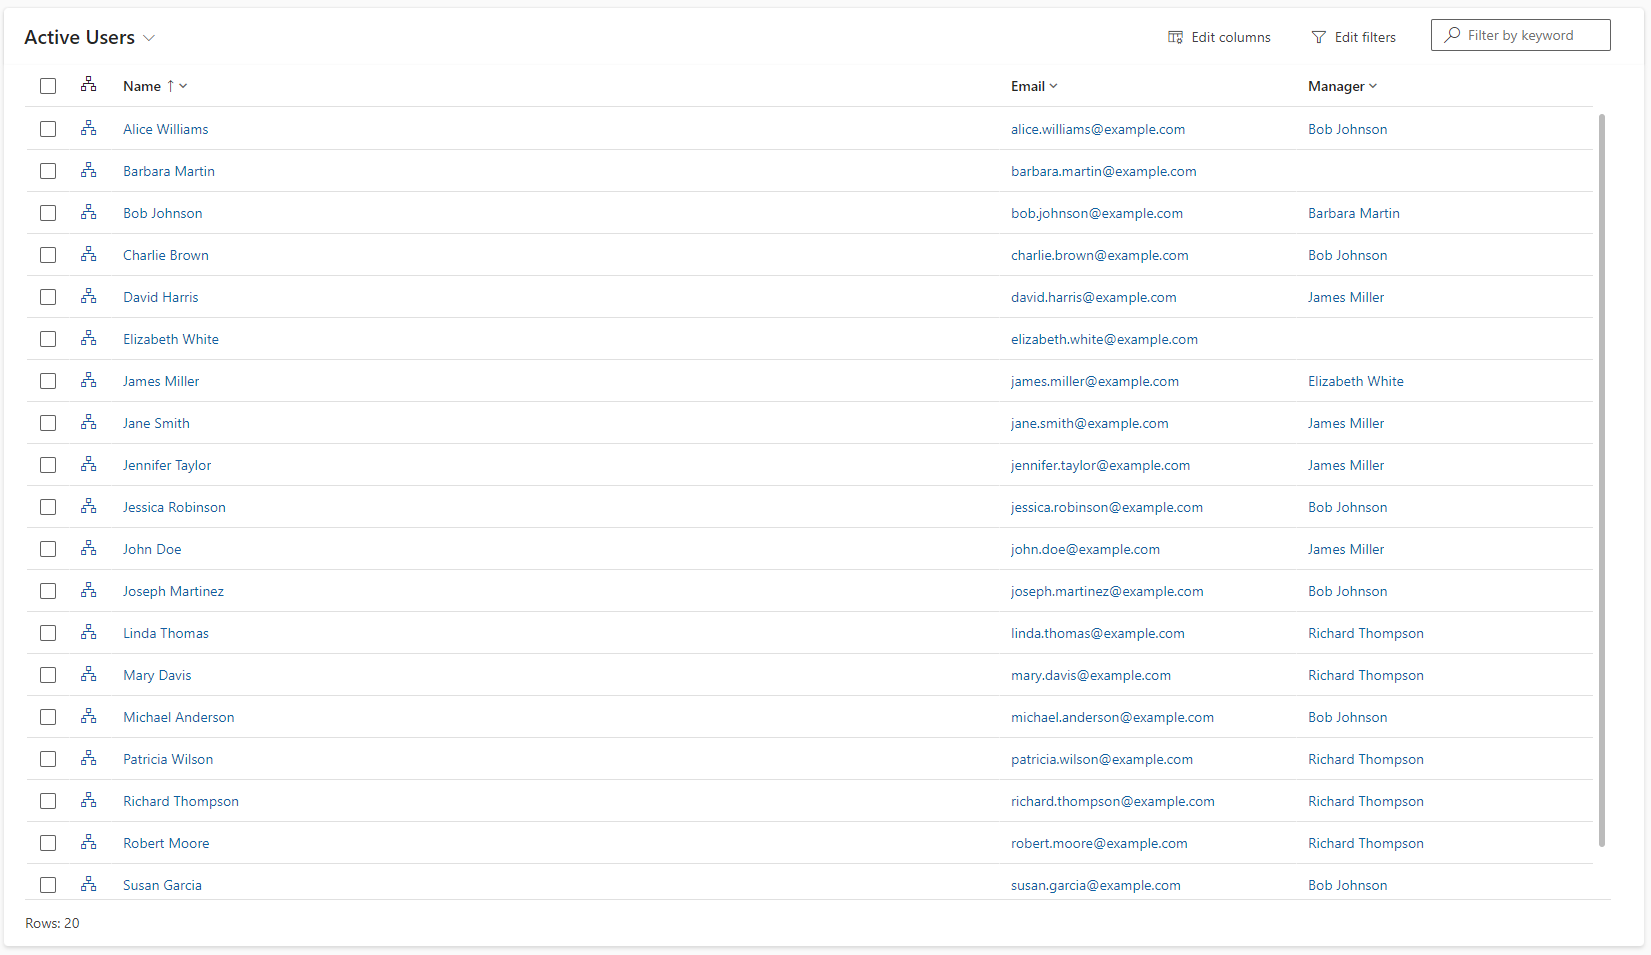
Update the the main form and view and populate the table with some fictional records.
Now the hierarchy has been enabled, we need to enabled visualisation so that we can display it in our app.
Visualise the hierarchy
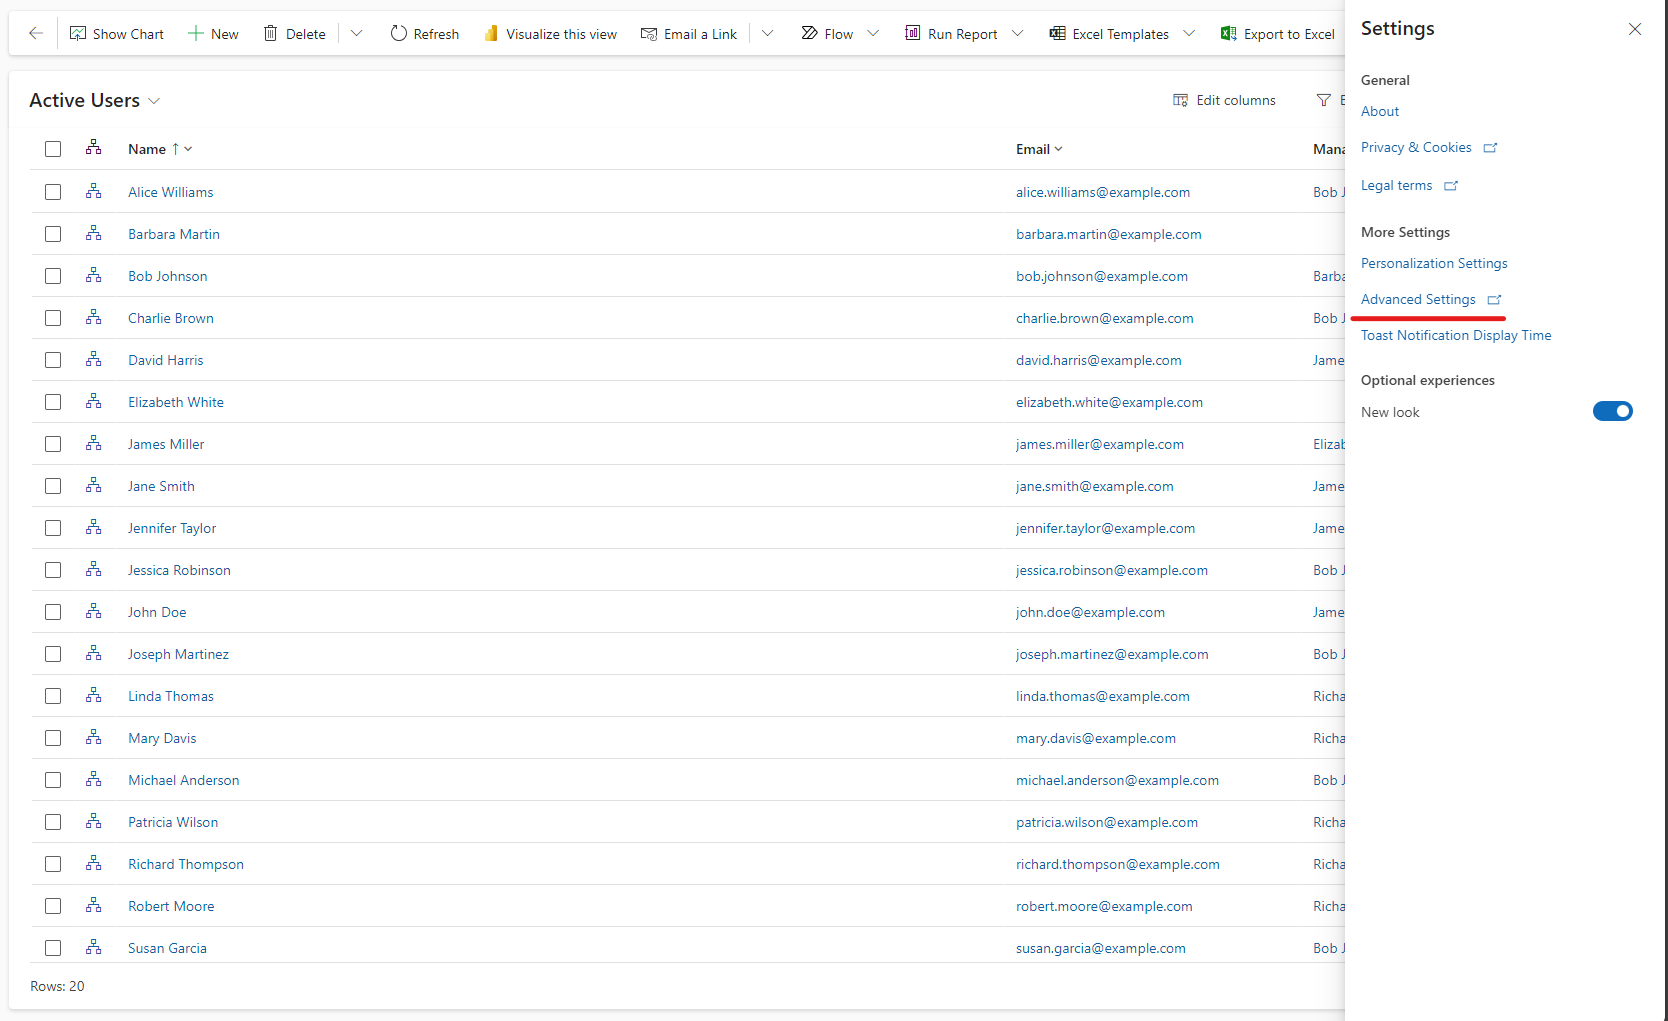
To visualise the hierarchy, we'll need to enable it in the classic settings. Navigate to the Settings cog at the top of the page, and select advanced settings.
Navigate to Solutions, if your table isn't in a solution, you can navigate to the table by going to Customizations instead.
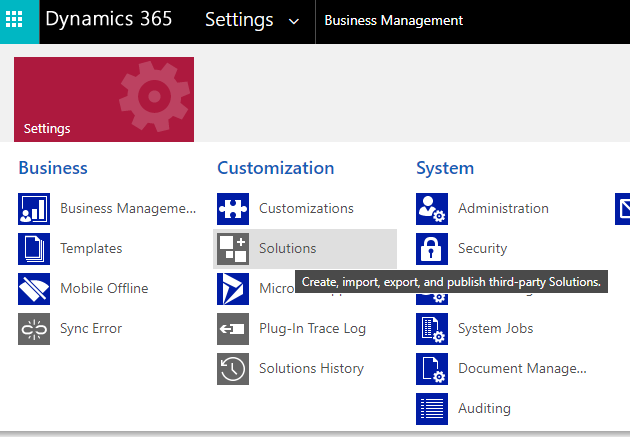
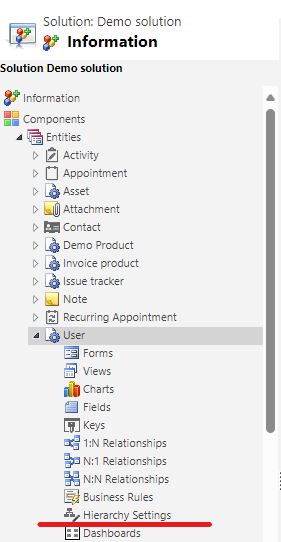
Select your solution, expand entities, and then the table you enabled hierarchy on and select Hierarchy Settings.
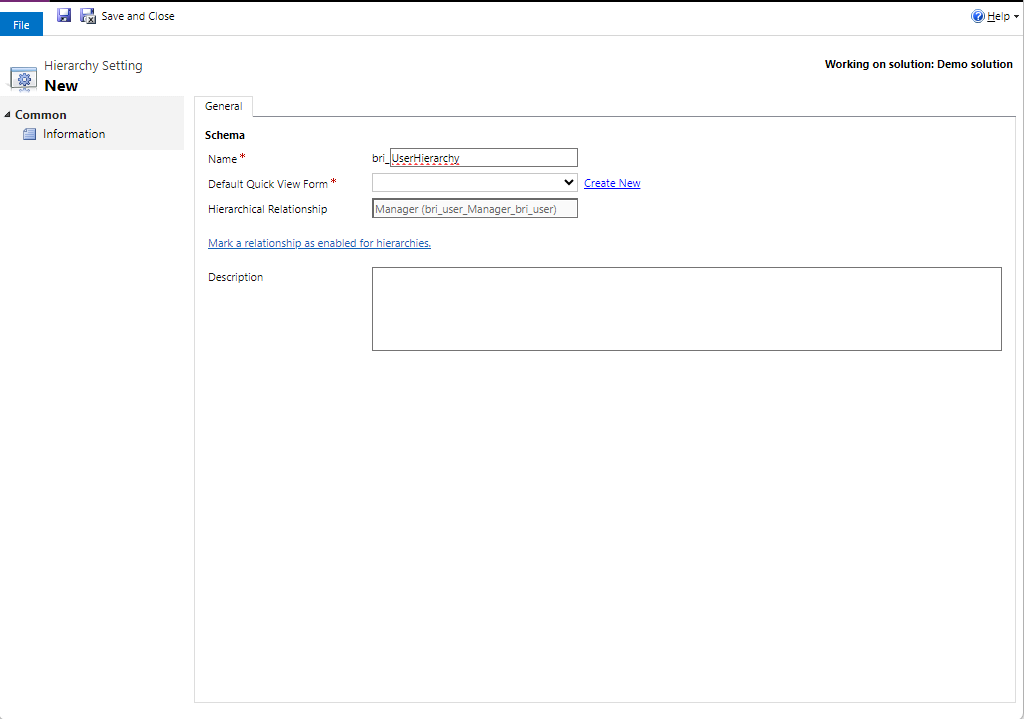
Click New, and add a name and specify the default quick view form, and then click Save and Close. This will have set up the visualisation for the hierarchy.
Now, on returning to the table within the App/view, the Hierarchy button next to the name can be selected, and it will open the hierarchy visualisation for that record.
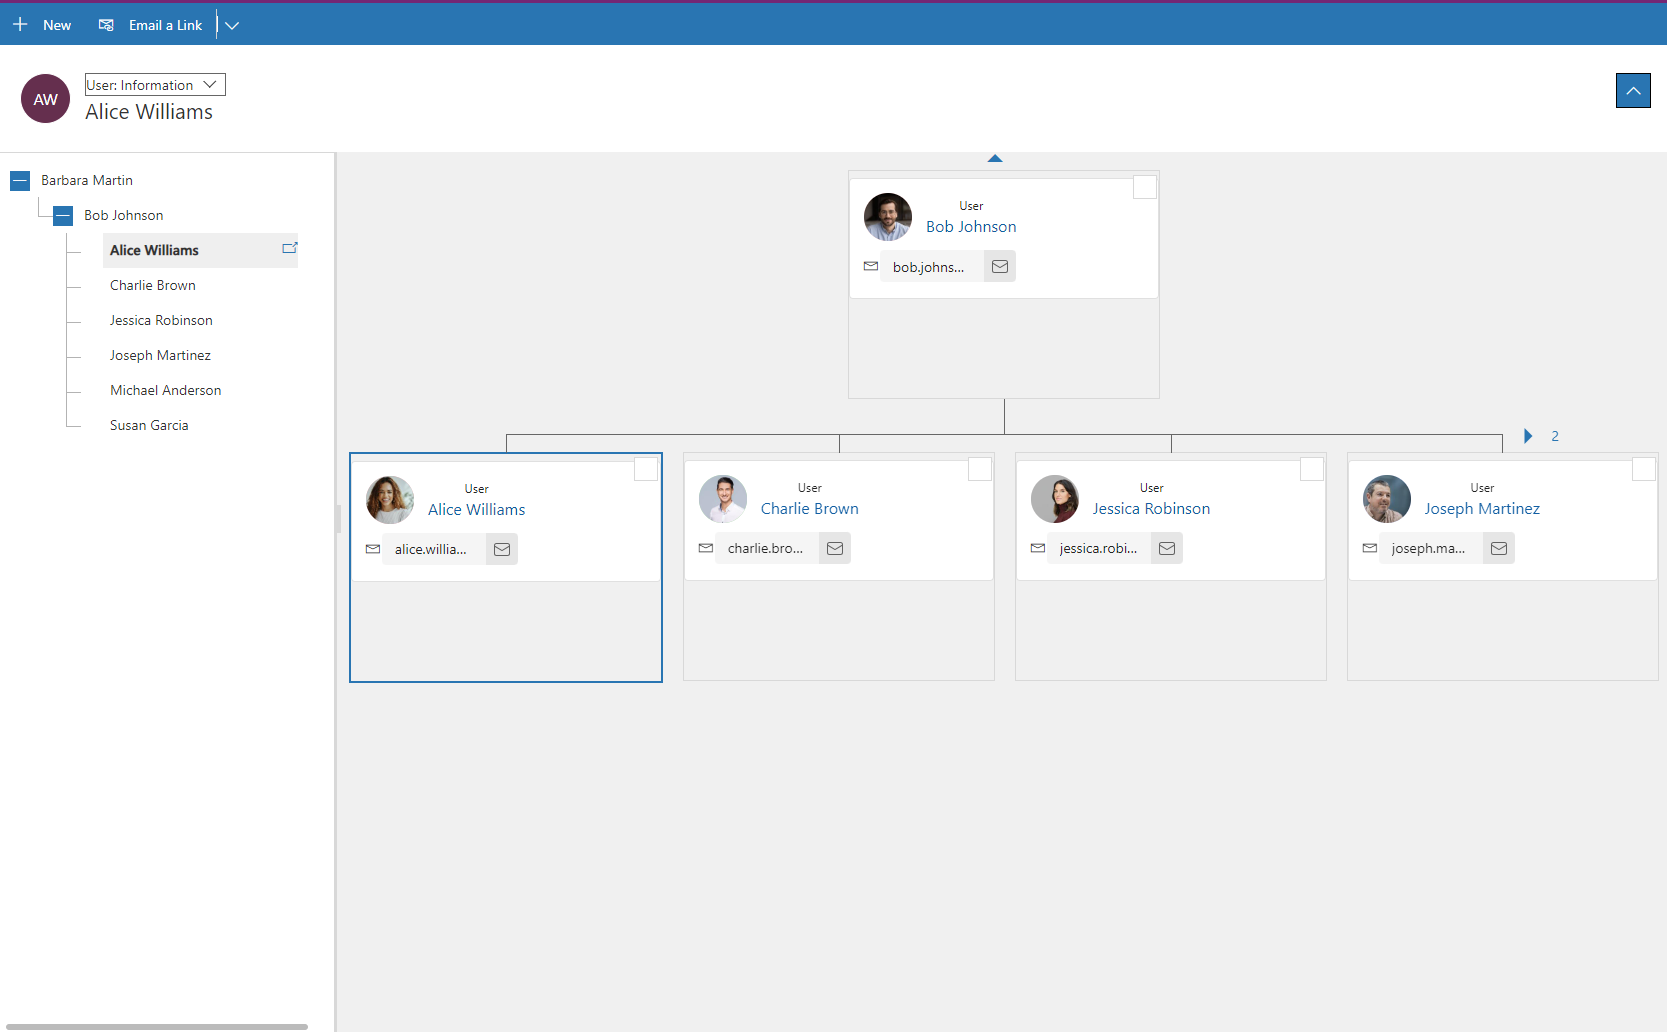
This shows a great way to display common scenarios such as org charts and can really help user visualise data in tables.

Member discussion: